


Please follow the link ( scroll down the page please):
EURJPY H1
Seb
Jumat, 28 Juni 2013
Kamis, 27 Juni 2013
Rabu, 26 Juni 2013


Selasa, 25 Juni 2013
EUR/USD M30 25.06.2013 Trade Ariel
EUR/USD
BUY
1 position: 1.3095
2 position: 1.3088
SL 1.3079
Risk: 26 pips

CLOSE: 1.3107
PROFIT:+30 PIPS
BUY
1 position: 1.3095
2 position: 1.3088
SL 1.3079
Risk: 26 pips
CLOSE: 1.3107
PROFIT:
Social Investment Network in your language
eToro social Investment Network is at the moment giving away a 20 dollar free coupon as I wrote about in my post “Social Investment Network: Make your First investment with a free 20 Dollar Coupon”.
On their social trading platform is the language in English; if you are from a different country like a German speaking country or Italy, Spain, France etc. and would like the trading platform in your own language watch the video from Etoro.
The video is in German but easy to understand as the changes in the language setting is well illustrated.
More information about eToro is on my website and in the post “Social Investment Network: Make your First investment with a free 20 Dollar Coupon”; in the post are links to more posts on this blog about Social Investment network.
Senin, 24 Juni 2013
EUR/JPY H1 Update
General Overview:
Previous Update is here:
http://elliottfxtrader.blogspot.com/2013/06/eurjpy-h4-update.html
Price is in a complex and time consuming corrective wave X and last 7 swing to the upside make it some sort of complex corrective pattern. That means more correction to the upside is anticiapted - no clear outlook right now.
Support/Resistance:
131.26 - Swing high
129.92 - 78%Fibo
126.92 - Weekly pivot
124.94 - Swing Low
Trading Recommendation:
Stay away until clear pattern emerge.
Seb
30-DAY FREE TRIAL ON WWW.RESISTANCEINVEST.COM
FOR ALL NEW CLIENTS.
JOIN NOW!!!
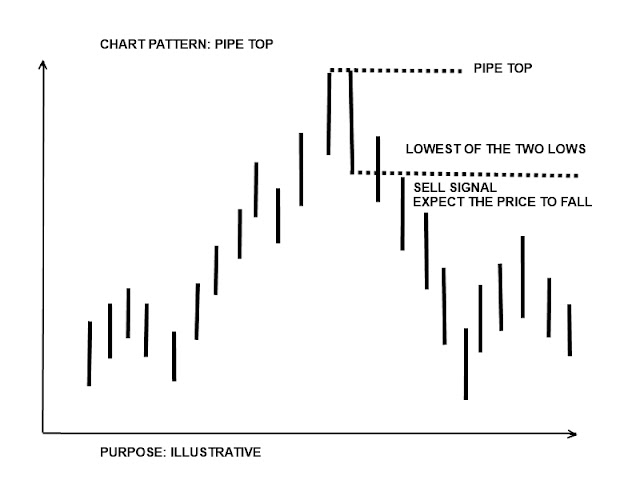
Chart Pattern: Pipe Top and Pipe Bottom
In earlier posts I have written about chart pattern; the posts are
In this post is the pipe top and pipe bottom illustrated. It is a pattern that gives the traders an indication of in which direction the price is moving in.
Pipe top
The pip top pattern is a pattern that ends in a top and then starts to fall; the image illustrates a bullish trend; the pattern ends with two candlesticks; when the lowest of the two lows ends the price is expected to fall.
Pipe bottom
The pip bottom pattern is a pattern that ends in a bottom and then starts to rise; the image illustrates a bearish trend; the pattern ends with two candlesticks; when the highest of the two highs ends the price is expected to rise.
 Note
Note
In the post is the term bullish and bearish used; a bullish market is when the price is rising and a bearish market is when a price is falling.
In the post is also the term candlestick used; more information about what a candlestick is in the article “Trading Forex Online? What Is a Candlestick Chart and How to Read a Candlestick Chart?”
- Chart Pattern: Double Top and Double Bottom
- Chart Pattern: The Triangle Pattern
- Chart Pattern: Diamond Bottom and Top Chart Pattern
- Trading the Crown or trading head and shoulders
In this post is the pipe top and pipe bottom illustrated. It is a pattern that gives the traders an indication of in which direction the price is moving in.
Pipe top
The pip top pattern is a pattern that ends in a top and then starts to fall; the image illustrates a bullish trend; the pattern ends with two candlesticks; when the lowest of the two lows ends the price is expected to fall.

Pipe bottom
The pip bottom pattern is a pattern that ends in a bottom and then starts to rise; the image illustrates a bearish trend; the pattern ends with two candlesticks; when the highest of the two highs ends the price is expected to rise.

In the post is the term bullish and bearish used; a bullish market is when the price is rising and a bearish market is when a price is falling.
In the post is also the term candlestick used; more information about what a candlestick is in the article “Trading Forex Online? What Is a Candlestick Chart and How to Read a Candlestick Chart?”
Success Stories: Social Investment Network
In earlier posts I have written about social Investment network in this video from eToro are two success stories from the social trading platform; in the anchor text to the video is written “…in this short video we give you 2 examples who have experienced success by socializing their trading skills and communicating with all their copiers…..”
eToro social Investment Network is at the moment giving away a 20 dollar free coupon; if you would like to make your first social investment with a free 20 dollar coupon on the social platform click on this link and claim the 20 dollar coupon.
More information about eToro Social Investment network is on my website with links to the trading platform; click here and visit my website.
EUR/USD H1 Update
General Overview:
Wave 1 should be finished now in five impulsive waves so sellig the rallys is the way to go now. First sell entry is for agressive traders, more classic one is on the previous wave four area of a lesser degree @ 1.3250 - 1.3290 area - this area merges with some important Fibo retracements.
If You like to ride a waves, You can buy the lows of wave 1 as well with stop loss below the low and take profit levels into sell areas.
Please notice that the alternate count indicates a possibility of WXY Irregular Flat Wave 4 correction as well so any impulsive development above 78.6%Fibo would put the count into question.
Support/Resistance:
1.3416 - Swing High
1.3343 - 78.6% Fibo
1.3250 - 1.3290 Classic Sell Entry Area
1.3175 - Agressive Sell Entry Area (tigh SL)
1.3098 - Swing Low
1.3000 - Alternate count invalidation line/Top confirmation
Trading Recommendation:
Sell the Agressive (tight SL) or Classical Sell Entry Area with SL above the Swing High in anticipation of larger cycle decline.
SIGNALS:
Forex Signal No.330a|Sell EUR/USD@1.3175|SL:1.3190|TP1:1.3100|2013.06.22 11:30 CET|ScalpSell|
Forex Signal No.330b|Sell EUR/USD@1.3250|SL:1.3420|TP1:1.2950|TP2:1.2750|2013.06.22 11:30 CET|SwingSell|
Forex Signal No.330c|Sell EUR/USD@1.3290|SL:1.3420|TP1:1.2950|TP2:1.2750|2013.06.22 11:30 CET|SwingSell|
Seb
30-DAY FREE TRIAL ON WWW.RESISTANCEINVEST.COM
FOR ALL NEW CLIENTS.
JOIN NOW!!!

USD/CHF H4 Update
General Overview:
There is still one more wave to the downside missing so all the upside rallys should be considered as corrective and the main objective now is to find the end of wave 4 and sell it.
I have two scenarios here:
SCENARIO 1: wave 4 will end on previous wave four area of a higher degree ( (iv) ) somewhere in the area of 0.9400 - 0.9417
SCENARIO 2: wave 4 will end higher into 50% Fibo somewhere in the area of 0.9483 - 0.9515.
Please notice that there is a possibility, that this wave 4 might be in shape of a TRIANGLE as well!
Support/Resistance:
0.9834 - Swing High
0.9590 - blue impulsive count invalidation line
0.9567 - 61%Fibo
0.9517 - 0.9483 SUPPLY ZONE OF WAVE 4
0.9400 - 0.9417 - SUPPLY ZONE OF WAVE 4
0.9132 - Swing Low
Trading Recommendation:
Sell the wave rallys inot the SUPPLY AREAS of 0.9400 - 0.9417 OR 0.9517 - 0.9483
SIGNALS:
Forex Signal No.336a|Sell USD/CHF@0.9417|SL:0.9437|TP1:0.9250|TP2:0.9137|2013.06.22 11:30 CET|SwingSell|
Forex Signal No.336b|Sell USD/CHF@0.9515|SL:0.9537|TP1:0.9250|TP2:0.9137|2013.06.22 11:30 CET|SwingSell|
Seb
30-DAY FREE TRIAL ON WWW.RESISTANCEINVEST.COM
FOR ALL NEW CLIENTS.
JOIN NOW!!!

CHF/PLN Weekly Update
General Overview:
Recent price development urged to change to count due to no impulsive price rection after previous wave 4 low. The new count indicates, that wave 4 is a classical traiangle pattern anr recent range breakout is first wave (i) to the upside that on Daily chart has been finished and now a correction is due. When corrective wave (ii) will be done, powerfull wave (iii) is just about the corner.
The Key Level is 55 period moving average - the last time price went to this level it was heavily bought.
If Extended Triangle pattern line will be broken, then this would be first clue that low is in.
Support/Resistance:
3.700 - Swing High
3.5500 - Extended Triangle pattern trend line
3.4750 - 100 WMA
3.4150 - 55 WMA
3.3000 - Wave one low/Bullish count invalidation level
3.2650 - Swing Low
Trading Recommendation:
Buy the dips with SL below 3.300 and POTENTIAL target of 4.100 easy.
Seb
30-DAY FREE TRIAL ON WWW.RESISTANCEINVEST.COM
FOR ALL NEW CLIENTS.
JOIN NOW!!!

NZD/USD H4 Update
General Overview:
The bullish divergence on Daily chart suggest the wave 3 has ended @ 0.7695 OR there is one small degree wave missing before the corrective bounce in wave 4 will occur.
The Key Level for further upside is at Key Zone: any breakout would mean more complex and time consuming correction.
Support/Resistance:
0.8135 - Swing High
0.8000 - 0.8050 - Key Zone
0.7915 - descending trend line resistance
0.7695 - Swing Low
Trading Recommendation:
Easy money has been done here so patience is required. More agressive traders can go long after the low of wave 5 is confirmed with the first target on 0.8000 zone.
Seb
30-DAY FREE TRIAL ON WWW.RESISTANCEINVEST.COM
FOR ALL NEW CLIENTS.
JOIN NOW!!!

AUD/USD H4 Update
General Overview:
I have re-vised and re-labeled the count again, but the change is almost purly aesthetic: the main problem for me was why the price has broken out to the downside from multi-year triangle formation and not to the upside desplite a lack of one more impulsive wave?
Based on that question I have changed the count and I have fount out, that there is still one more possibility for this very complex and time consuming wave 4 to be valid - the result is on Weekly chart.
On the other hand, on H4 chart one can see a pretty rare ending formation calle Expanding Ending Diagonal Triangle. What supports this view is the fact, that there is heavy buying on futures market if price is makieng a new low.
Still the target for wave 4 is geometrical harmony of A = C @ 0.8957 - 0.9000 area.
Support/Resistance:
0.9594 - Swing High
0.9470 - Key Level/Trend Line Resistance
0.9100 - Swing Low
0.8957 - Wave C Target
Trading Recommendation:
Easy money has been done here so patience is required.Go long ONLY after confirmation on Daily Candle.
Seb
30-DAY FREE TRIAL ON WWW.RESISTANCEINVEST.COM
FOR ALL NEW CLIENTS.
JOIN NOW!!!
24.06.2013 - GBP/USD M30
Buy GBP/USD
1 position 1.5357
2 position 1.5350
SL 1.5339
RISK 27 pips
TP 1.5410


1 position 1.5357
2 position 1.5350
SL 1.5339
RISK 27 pips
TP 1.5410
CLOSE POSITION:
RISK: 27 PIPS PROFIT: 50 PIPS R/R 1,85
The Forex Heatmap ® Educational Blog Is Moving !
The 35 forex lessons detailing the the Forexearlywarning system are now linked at their new location on Forexearlywarning.com.
At some point this blog will be completely disabled and the remaining content will be moved to Forexearlywarning.com
Langganan:
Postingan (Atom)
