Pages

Sabtu, 14 Desember 2013

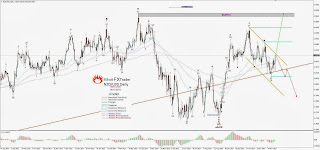
Bitcoin Elliott Wave Analysis H4 & Daily


General Overview for 14/12/2013:
The speculatiove bublle on its best.
You have not seen the top in bitcoin yet.
Projected support level is based on One-to-One geometry levels with some fractal showing up on H4 charts.
Any price below 700 means the market is still in corrective cycle of wave 4 pink with possible Triangle shape.

Support/Resistance:
1090 - All Time High
  968 - Techncial Resistance
  900 - Techncial Resistance
  822 - Techncial Support
  736 - Target Level
  700 - Invalidation Line

Trading Recommendation:
Buy  @ 736 with SL @ 698 and TP1 @ 968 and TP2 @ 1090.
★★★★★★★★★★★★★★★★★★★★★★★
As You might have noticed I'm taking a part in "Analyst of the year" contest organised by InstaForex  broker MT5.com portal.
AND
If You like my analysis or You trade it, or You have learnt something new this is my plea to ALL OF YOU: Please vote for me EVERYDAY!

It is free, simple and easy to vote for me EVERYDAY!

This is what You have to do in four easy steps:
1. Register on MT5.COM forum here (use gmail, hotmail or yahoo) :http://www.mt5.com/Register/
2. Wait for confirmation email and activation link
4. Click on RAISE UP

THATS IT!

BIG THANK YOU!
★★★★★★★★★★★★★★★★★★★★★★★


Kamis, 12 Desember 2013

Trading CFD: Correlation between AUD/CHF, AUD/USD and EUR/USD

In the post CFD Trading: Correlation between Currency Pairs is written about some common correlation between currency pairs.

In this post
In this post is the focus on the correlation between the AUD/CHF and AUD/USD. The correlation between the AUD/CHF and the EUR/USD is also illustrated.

The purpose is illustrative only.

Correlation
The correlation between currency pairs can be stronger or weaker over a time period. 

In this post is illustrated how the correlation is at the 15 minute charts; the correlation could be stronger or weaker if the correlation was illustrated in charts where the time period was longer or shorter.

Often is the correlation strong or weak as illustrated. The correlation can also be opposite as illustrated in the charts from 10:45.

The correlation between AUD/CHF and AUD/USD
The charts illustrate the correlation between the AUD/CHF and AUD/USD; the charts illustrate a positive correlation between the currency pairs.

The correlation is weaker at 10:45 than it was between 1:45and 10:45as the AUD/CHF is decreasing and the AUD/USD becomes flatter.


The correlation between AUD/CHF and EUR/USD
The charts illustrate the correlation between the AUD/CHF and EUR/USD; the charts illustrate a negative correlation between the currency pairs.

The correlation is weaker at 12:30 than it was between 1:45and 10:45as the AUD/CHF is increasing and the AUD/USD is increasing.


Selasa, 10 Desember 2013

SP500 Futures H4 & Daily


Please click on the link:

Thanks,
Seb
★★★★★★★★★★★★★★★★★★★★★★★
As You might have noticed I'm taking a part in "Analyst of the year" contest organised by InstaForex  broker MT5.com portal.
AND
If You like my analysis or You trade it, or You have learnt something new this is my plea to ALL OF YOU: Please vote for me EVERYDAY!

It is free, simple and easy to vote for me EVERYDAY!

This is what You have to do in four easy steps:
1. Register on MT5.COM forum here (use gmail, hotmail or yahoo) :http://www.mt5.com/Register/
2. Wait for confirmation email and activation link
4. Click on RAISE UP

THATS IT!

BIG THANK YOU!
★★★★★★★★★★★★★★★★★★★★★★★
 

Correlation between NZD/USD and EUR/USD, GPB/USD, AUD/USD

Correlation between currency pairs is a factor in trading CFD and should be considered before entering a trade.

In this post is the correlation between the NZD/USD and EUR/USD, GPB/USD, AUD/USD illustrated visual in the charts under the section Visual illustration. The purpose is to exemplify the correlation between currency pairs and give a little inspiration on how to think as a trader.

The correlation between NZD/USD and EUR/USD, GPB/USD, AUD/USD are usually strong as changes in the USD has effect on all the currency pairs in the same direction.

Visual illustration
Visual are the charts NZD/USD and EUR/USD, GPB/USD, AUD/USD illustrated; the charts illustrate how the currency pairs are moving in the same direction with a small delay. 


The NZD/USD is increasing (bullish) approximately at 2:15 and again at 9:45which is also the case for the EUR/USD, GPB/USD and AUD/USD; some of the currency pairs start to rise (bullish) at approximately 9:00 o’clock.  The EUR/USD is rising (bullish) for a shorter period than the NZD/USD, GPB/USD and AUD/USD. 

EUR/USD H1


Thanks,
Seb
★★★★★★★★★★★★★★★★★★★★★★★
As You might have noticed I'm taking a part in "Analyst of the year" contest organised by InstaForex  broker MT5.com portal.
AND
If You like my analysis or You trade it, or You have learnt something new this is my plea to ALL OF YOU: Please vote for me EVERYDAY!

It is free, simple and easy to vote for me EVERYDAY!

This is what You have to do in four easy steps:
1. Register on MT5.COM forum here (use gmail, hotmail or yahoo) :http://www.mt5.com/Register/
2. Wait for confirmation email and activation link
4. Click on RAISE UP

THATS IT!

BIG THANK YOU!
★★★★★★★★★★★★★★★★★★★★★★★
 

GBP/USD H1


Thanks,
Seb
★★★★★★★★★★★★★★★★★★★★★★★
As You might have noticed I'm taking a part in "Analyst of the year" contest organised by InstaForex  broker MT5.com portal.
AND
If You like my analysis or You trade it, or You have learnt something new this is my plea to ALL OF YOU: Please vote for me EVERYDAY!

It is free, simple and easy to vote for me EVERYDAY!

This is what You have to do in four easy steps:
1. Register on MT5.COM forum here (use gmail, hotmail or yahoo) :http://www.mt5.com/Register/
2. Wait for confirmation email and activation link
4. Click on RAISE UP

THATS IT!

BIG THANK YOU!
★★★★★★★★★★★★★★★★★★★★★★★
 

Gold XAUUSD H4


Thanks,
Seb
★★★★★★★★★★★★★★★★★★★★★★★
As You might have noticed I'm taking a part in "Analyst of the year" contest organised by InstaForex  broker MT5.com portal.
AND
If You like my analysis or You trade it, or You have learnt something new this is my plea to ALL OF YOU: Please vote for me EVERYDAY!

It is free, simple and easy to vote for me EVERYDAY!

This is what You have to do in four easy steps:
1. Register on MT5.COM forum here (use gmail, hotmail or yahoo) :http://www.mt5.com/Register/
2. Wait for confirmation email and activation link
4. Click on RAISE UP

THATS IT!

BIG THANK YOU!
★★★★★★★★★★★★★★★★★★★★★★★
 

NZD/USD H1


Please click on the link:
Thank You,
Seb

★★★★★★★★★★★★★★★★★★★★★★★
As You might have noticed I'm taking a part in "Analyst of the year" contest organised by InstaForex  broker MT5.com portal.
AND
If You like my analysis or You trade it, or You have learnt something new this is my plea to ALL OF YOU: Please vote for me EVERYDAY!

It is free, simple and easy to vote for me EVERYDAY!

This is what You have to do in four easy steps:
1. Register on MT5.COM forum here (use gmail, hotmail or yahoo) :http://www.mt5.com/Register/
2. Wait for confirmation email and activation link
4. Click on RAISE UP

THATS IT!

BIG THANK YOU!
★★★★★★★★★★★★★★★★★★★★★★★
 

Senin, 09 Desember 2013

CFD Trading: Goals

I have been studying the tropic positive psychology a bit deeper the last couple of months.

One of the interesting part is that well-being is valued higher when a person can explain why he or she is at certain points in life but also can explain how to come to the next level.

Another interesting part is that well-being is connected to grow and our well-being is increasing as we grow but only if we have an influence on the progress. Well-being can also be life stages where the goals are reached and where the feeling complacency and tranquility is present.

Well-being in connection to CFD
Well-being is also important in trading CFD as we have to set goals for our trading; the purpose is to measure if we reached our goals. An example of a goal could be a surplus of 20 pips each trading day.

A trading plan is also important as it explains why you are acting as you are; it explains also your goals and if you have reached them; in connection to positive psychology should it have influences on your well-being as you know why you are entering a trade and why you are closing a trade.

Writing your goals
Writing a trading plan makes you more conscious about the goals you want to achieve and how to achieve them. Your conscious about your goals makes it also easier to reach them.

More about psychology trading
In the articles;


are written about visualization techniques that might be helpful in growing your well-being in trading CFD.

USD/CAD H1 & H4


Thanks,
Seb
 
★★★★★★★★★★★★★★★★★★★★★★★
As You might have noticed I'm taking a part in "Analyst of the year" contest organised by InstaForex  broker MT5.com portal.
AND
If You like my analysis or You trade it, or You have learnt something new this is my plea to ALL OF YOU: Please vote for me EVERYDAY!

It is free, simple and easy to vote for me EVERYDAY!

This is what You have to do in four easy steps:
1. Register on MT5.COM forum here (use gmail, hotmail or yahoo) :http://www.mt5.com/Register/
2. Wait for confirmation email and activation link
4. Click on RAISE UP

THATS IT!

BIG THANK YOU!
★★★★★★★★★★★★★★★★★★★★★★★
 

EUR/JPY H1,H4 and Daily


Please click in the link here:

Thank You,
Seb

★★★★★★★★★★★★★★★★★★★★★★★
As You might have noticed I'm taking a part in "Analyst of the year" contest organised by InstaForex  broker MT5.com portal.
AND
If You like my analysis or You trade it, or You have learnt something new this is my plea to ALL OF YOU: Please vote for me EVERYDAY!

It is free, simple and easy to vote for me EVERYDAY!

This is what You have to do in four easy steps:
1. Register on MT5.COM forum here (use gmail, hotmail or yahoo) :http://www.mt5.com/Register/
2. Wait for confirmation email and activation link
4. Click on RAISE UP

THATS IT!

BIG THANK YOU!
★★★★★★★★★★★★★★★★★★★★★★★
 

Minggu, 08 Desember 2013

NZD/USD H1, Daily & Weekly


General Overview for 08/12/2013
The whole count has been re-visited and re-labeled for the most appropriate structure.
On Weekly chart the most important and problematic structure is Expanding Leading Diagonal in Wave (1) and then the very complex  and time consuming wave (2) correction that ended up with a possible truncation of wave 5 of wave C. This is rather very bullish sign here, but the alternate count still indicates a possible wave XX as a part of unfinished wave B complex corrective structure.
Lower time frames seem to confirm the vullish outlook, however the main golden trend line has not been broken yet and first test from the downside has been rejected so far. On intraday H1 time frame price has broken above previous wave four area and closed the old GAP during news relase as well so both are bullish clues here. Key level is 0.8233 level as a very important support for bulls.

Support/Resistance:
0.8405 - Swing High
0.8282 - 61% Fibo | Intraday golden trend line resistance |
0.8258 - 0.8264 - Previous wave four zone
0.8233 - Key Level
0.8137 - 0.8155  - DEMAND ZONE | old GAP zone |

Trading Recommendation:


Bias is to the upside to complete the impulsive wave progression. Buy the dips into 0.8233 zone.
Pattern in progress: Wave (iii)  of wave 1
Pattern in question: - If level 0.8137 is broken
Pattern Invalidation: -If level 0.808 is broken


★★★★★★★★★★★★★★★★★★★★★★★
As You might have noticed I'm taking a part in "Analyst of the year" contest organised by InstaForex  broker MT5.com portal.
AND
If You like my analysis or You trade it, or You have learnt something new this is my plea to ALL OF YOU: Please vote for me EVERYDAY!

It is free, simple and easy to vote for me EVERYDAY!

This is what You have to do in four easy steps:
1. Register on MT5.COM forum here (use gmail, hotmail or yahoo) :http://www.mt5.com/Register/
2. Wait for confirmation email and activation link
4. Click on RAISE UP

THATS IT!

BIG THANK YOU!
★★★★★★★★★★★★★★★★★★★★★★★


Nikkei 225 Futures Daily


General Overviev for 08/12/2013
The anticipated Triangle formation breakout has been developing properly and now the fianl attack to new highs should be in play. The target area for main count is 16110 - 16337. If this highs are broken then the alternate count is in play and this one us slightly more bullish than the main one. It projects the Target Zone for wave 5 @ 16782 - 17154 (quite wilde).
Price has bounced from main channel upper line and as long as it stays within acceleration channel more high are in view.

Support/Resistance:
16782 - 17154 - Alternate Target Zone Projection
16110 - 16337 - Main Target Zone Projection
15936 - Swing High
14957 - Technical Support

Trading Recommendations:
As long as technical support zone holds buying the dips shoud be in play. Target zone on chart.
★★★★★★★★★★★★★★★★★★★★★★★
As You might have noticed I'm taking a part in "Analyst of the year" contest organised by InstaForex  broker MT5.com portal.
AND
If You like my analysis or You trade it, or You have learnt something new this is my plea to ALL OF YOU: Please vote for me EVERYDAY!

It is free, simple and easy to vote for me EVERYDAY!

This is what You have to do in four easy steps:
1. Register on MT5.COM forum here (use gmail, hotmail or yahoo) :http://www.mt5.com/Register/
2. Wait for confirmation email and activation link
4. Click on RAISE UP

THATS IT!

BIG THANK YOU!
★★★★★★★★★★★★★★★★★★★★★★★

EUR/USD H4


Video analysis is here:
https://www.youtube.com/watch?v=SVomvZrH2IA


★★★★★★★★★★★★★★★★★★★★★★★
As You might have noticed I'm taking a part in "Analyst of the year" contest organised by InstaForex  broker MT5.com portal.
AND
If You like my analysis or You trade it, or You have learnt something new this is my plea to ALL OF YOU: Please vote for me EVERYDAY!

It is free, simple and easy to vote for me EVERYDAY!

This is what You have to do in four easy steps:
1. Register on MT5.COM forum here (use gmail, hotmail or yahoo) :http://www.mt5.com/Register/
2. Wait for confirmation email and activation link
4. Click on RAISE UP

THATS IT!

BIG THANK YOU!!!
★★★★★★★★★★★★★★★★★★★★★★★

GBP/CAD H4 & Daily


 General Overview for 08/12/2013:

Bullisg wave progression on this pair is almost done and there is one more wave to the upside left (wave 5) to complete the cycle in wave C green of 4 blue circle.
The main level of supprt is 1.7344 but there is nothing wrong with more deeper correction in wave 4 down to 1.7250 area before uptrend resumes.
The shape of the correction is unknown so far, however it is very probable that it could be Triangle shape.

Support/ Resistance:
1.7546 - Swing High
1.7344 - Intraday Support
1.7245 - Previous wave four zone
1.7157 - Technical Support
1.7007 - 1.6960 - Technical Support Zone

Trading Recommendations:
As long as support level is not broekn the bias is to the upside and dips shpuld be bought in anticipation one wave 5 to the upside. First target is last high, then more.

★★★★★★★★★★★★★★★★★★★★★★★
As You might have noticed I'm taking a part in "Analyst of the year" contest organised by InstaForex  broker MT5.com portal.
AND
If You like my analysis or You trade it, or You have learnt something new this is my plea to ALL OF YOU: Please vote for me EVERYDAY!

It is free, simple and easy to vote for me EVERYDAY!

This is what You have to do in four easy steps:
1. Register on MT5.COM forum here (use gmail, hotmail or yahoo) :http://www.mt5.com/Register/
2. Wait for confirmation email and activation link
4. Click on RAISE UP

THATS IT!

BIG THANK YOU!!!
★★★★★★★★★★★★★★★★★★★★★★★