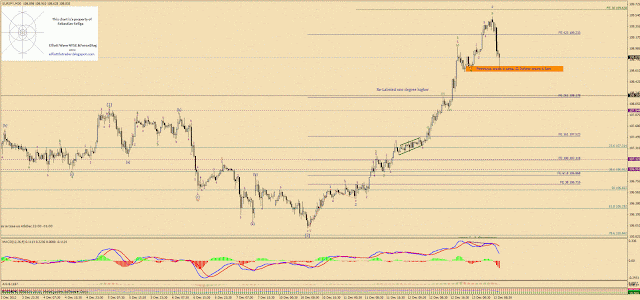
I'm almost sure EUR/JPY needs a correction.
The levels for corrective wave (4) are on charts.
Please notice that the most common wave (4) corrective pattern is a Triangle so there might be a lot of whipsaws ahead for this pair.
Take care,
Seb
Jumat, 14 Desember 2012
Gold XAUUSD Daily Update
After invalidating bullish count , this is what I do expect from Gold, so if You are bullish please take it into considearion
Seb
Seb
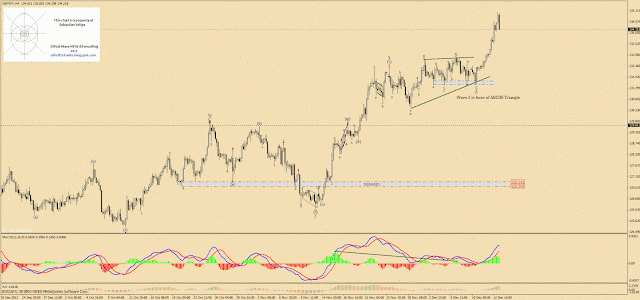
GBP/JPY H1 Update
Either:
wave 4 was qucik and shallow Irregular Flat correction ( rule of alternation to wave 2 apply here perfectly) and next five waves are the final push to the upside and the top for big wave 3
or
latest five waves to the upside are just the first wave of larger wave 5 to come.
Any move higher or lower the current swings will invalidate one of the counts.
Take care,
Seb
GBP/USD H1 Update
First orange rectangle has been hit and first scenario for wave 2 low has been activated. So far not much of impulsive development.
If You traded this You should bank about 40-50 pips.
Seb
If You traded this You should bank about 40-50 pips.
Seb
EUR/USD M30 & H1 Update
The H1 count is the one I'm in favour right now because the impulsive structure is very clear for me.
The M30 count just describes some probabilities as the caount changes when new pattern develops.
Wave B idea does not fit into this count anymore.
So, what's next according to H1 count? Correction. What do we do and why? We BUY the dips into Fibo, Technical Resistance or Pivot levels.
Seb
The M30 count just describes some probabilities as the caount changes when new pattern develops.
Wave B idea does not fit into this count anymore.
So, what's next according to H1 count? Correction. What do we do and why? We BUY the dips into Fibo, Technical Resistance or Pivot levels.
Seb
EUR/USD M30 Update: Very Interesting
Couple of different charts: Running Flat and Triangle.
Time will tell, but overall it looks bullish.
Seb
Time will tell, but overall it looks bullish.
Seb
EUR/USD H1 Update
Again, I've been expecting one more wave to the downside before any rally might resumes but it looks like I missed something: yesterday evening I have labeled wave W and X expecting wave Y to come and finish the cycle of a little more complex wave 4 and this idea would fit the Rule of Alternation.
Altrought, today EUR/USD is at new local high so somewhere there I must have missed a wave. On the other hand it fits alt. count suggesting wave 1 has finished, wave W is first leg of Running Flat correction with very short wave C.
I went down to 5min to see what I did wrong. And it looks like I have missed the obvious: A Triangle wave 4!
There is one count of EUR/USD H1 that I have showed You guys at the begining of the week wuith only bullish option and this is update for it.
I guess wave 1 of this count will end in SUPPLY area, then EUR/USD will begin the correction.
Take care,
Seb
EUR/JPY: What's next?
So far all correctiove movements were rather fast, shallow and did not last much in time, so it might be the time for some more complex and time consuming correction - but nothing is certain.
On chart there are two possible levels for wave 4 correction area, as discussed this morning.
Please notice that still the most probable corrective pattern of wave 4 is a triangle so buying the dips of EUR/JPY as along as orange recangle area is not broken down seems to be the way to trade this pair for now.
Take care,
Seb
S&P500 H1 & H4 Update
Bullish count has been invalidated and the recent leg up turned out to be in three waves abc making a top of wave 2 into 1438.75 level.
Nice impulsive progression so far, we will see what will happen next.
Seb
Nice impulsive progression so far, we will see what will happen next.
Seb
AUD/USD H4 Update
Trend line test from the upside and three waves down suggest more strenght comming if trend line not broken through.
Seb
Seb
Kamis, 13 Desember 2012
AUD/USD H4 Update
So far, so good.
Buy the dips on the way to 1.0500 trend line test, median line test and supply-turned-to-demand area test.
Take care,
Seb
Buy the dips on the way to 1.0500 trend line test, median line test and supply-turned-to-demand area test.
Take care,
Seb
GBP/USD H1 Update + TPI
Rationale:
The most probable pattern of wave 2 bottom @ 1.6000 is not that clear anymore and it looks like we got some more complex correction here due to the fact that there is not much of impulsive movement continuation at the moment. Nevertheless, I'm still more bullish on GBP/USD until proven otherwise, so I can expect more upside impulsive movement after this correcion will be over in shape of almight wave 3.
There are two possibilities of corrective wave development there: Running or Irregular Flats for example. Levels for this ideas are on chart.
Please use tight stops just below the rectangle area if You are planning to trader Running Flat
Entry:
Running Flats two levels on chart just as the orange rectangle shows:
Area 1 - 1.6090 - 1.6081, SL: Just below.
Area 2 - 1.6066 - 1.6060, SL Just below.
If that two levels are broken, wait for better R/R opportunity.
Take care,
Seb
Crude Oil Futures H4 Update
So far outlook is as it is on picture - nothing is sure but the breakout will come - this way or another.
Time will tell.
Seb
Time will tell.
Seb
EUR/JPY M30 Update + TPI
Old school idea of buy previous wave 4 area here.
It is the same as Idea (1) presented this morning but with better R/R ratio.
SL below wave 4 low!!!
Seb
It is the same as Idea (1) presented this morning but with better R/R ratio.
SL below wave 4 low!!!
Seb
Gold XAUUSD Daily Update
Please notice the alternative count for Gold: wave 4 has not been finished yet in this count.
Bullish count invalidation level on chart.
Seb
Bullish count invalidation level on chart.
Seb
GBP/JPY H1 & H4 Update + TPI
Rationale:
Two different counts here with slighty differnet outputs.
On H1 there is a Double Three wave 2 count with latest wave labeled as wave 3. Right now the price is looking for a levet to retrace to - then one more to the upside possible. Probably this wave 4 will be simple correction because wave 2 was complex time consuming Double - Three.
On H4 chart there is a Triangle count for comparasion. In this count the latest wave up was the wave 1 of more impulsive development to come. Please notice that wave 2 Triangle pattern is very rare but this one fits very nice.
Entry levels on charts. Use Tight Stops!
Take care,
Seb
EUR/AUD H1 Update
Price needs to remain above 1.2325 to see a test of 61.8 fib. Failure @ 61.8 fib would leave the pair vulnerable to further losses as wave (c) will develop.
Seb
Seb
Gold XAUUSD H4 Update
Please notice the alternative count that points to futher losses in Gold as wave 4 has not moght be finished yet. Break below latest swing low will confirm the alternative count.
Seb
Seb
EUR/JPY M30,H4&Daily Update + TPI
Rationale:
Count re-labeled one degree higher due to all my effords to catch wave 5 top were in vain.
Please notice on daily chart where the next supply area is: 110.76 - 111.52. If this is proper count, we should have:
- one more wave up to finish cycle,
- then wave 2 correction maybe to 108.20 area to test the recent breakup level.
-then wave 3 to rally to supply area
Entry:
(1) The most obvious place to trade here is to go long in anticipation of wave 5 when price will get to 108.60 - 109.00 area.
(2) The second trade is to short the wave 5 top. I will send a signal when I find wave 5 top.
(3) Third trade is to buy wave 2 bottom, this is the most secure and risk free trade of all three. The area to buy might be the previous wave 1 high @ 108.17 (max. 107.93)
Take care,
Seb
EUR/USD: What's next?
This wave progression does not look to me like ABC Expanded Flat Corrective pattern anymore: sub-wave C wave is too much expanded in relation to other waves. It "looks" more like wave 3 to be honest and this means EUR/USD will make a new high after wave 4 retracement. This is one of the possible scenarions I had posted here on Saturday update.
With the last move up EUR/USD passed through supply level and has hit 88.6%Fibo Ret level to the pip. There is no divergence on MACD or AO what indicates the momentum is strong and the up cycle has not been finished yet.
The first level to look for buying opportunity is 1.3018 area of technical support, WR1 and 38%Fib Ret. Nevertheless, it is possible for price to penetrate 50% FibRet area and previous wave 4 area but anything below that level is rather more bearish than bullish.
Seb
USD/CHF H4 Update
Not very much impressed with this chart but it looks like it works quite well.
Take it with grain of salt.
Seb
Take it with grain of salt.
Seb
Langganan:
Komentar (Atom)


1.png)

2.png)


