Pages

Sabtu, 07 Desember 2013

GBP/USD H1,H4,Daily & Weekly


General Overview for 07/12/2013
The impulsive wave progression is almost done and cable is in corrective cycle wave 4. There is last wave (e) missing to the downside and then rebound is expected and new high should be made. The target level for wave 5 is 1.6513 - 1.6538 zone, where some Fibo projection levels cluster together. The is more clues to support this view: first one is a long lasting Bearish Divergence on H4 and now on Daily chart as well. Second is the slope on Non Linear Regression model that points downward, but the risk tail SELL ZONE still leaves the room for the target area to be hit.
From Time Cycle aanlysis the most important dated for cable are 13th and 23th December 2013 where couple of Fibo Price Clusters gathered.

Support/Resistance:
1.6188 - WS3
1.6119 - 1.6240 - KEY ZONE | SUPPLY BREAKTHROUGH ZONE|
1.6243 - WS2
1.6257 - 1.6266 - Fresh Demand Zone
1.6291 - WS1
1.6295 - 1.6315 - DEMAND ZONE
1.6346 - Weekly Pivot
1.6395 - WR1
1.6441 - Swing High
1.6450 - WR2
1.6513 - 1.6538 - Target Area For Wave 5

Trading Recommendations:
Buying the dips in DEMAND zone in anticipation of wave 5 to the upside is the way to go here.

★★★★★★★★★★★★★★★★★★★★★★★
As You might have noticed I'm taking a part in "Analyst of the year" contest organised by InstaForex  broker MT5.com portal.
AND
If You like my analysis or You trade it, or You have learnt something new this is my plea to ALL OF YOU: Please vote for me EVERYDAY!

It is free, simple and easy to vote for me EVERYDAY!

This is what You have to do in four easy steps:
1. Register on MT5.COM forum here:http://www.mt5.com/Register/
2. Wait for confirmation email and activation link
4. Click on RAISE UP

THATS IT!

BIG THANK YOU!!! 
★★★★★★★★★★★★★★★★★★★★★★★


Kamis, 05 Desember 2013

EUR/USD M30 & H1

Still too much confusion on lower time frames to conclude anything important but the SELL ZONE is still in play.

As You might have noticed I'm taking a part in "Analyst of the year" contest organised by InstaForex  broker MT5.com portal.
AND
If You like my analysis or You trade it, or You have learnt something new this is my plea to ALL OF YOU: Please vote for me EVERYDAY!

It is free, simple and easy to vote for me EVERYDAY!

This is what You have to do in four easy steps:
1. Register on MT5.COM forum here:http://www.mt5.com/Register/
2. Wait for confirmation email and activation link
3.Click on the link:http://www.mt5.com/forex_analysis_award/profile/index/elliottfxtrader
4. Click on RAISE UP

THATS IT!

BIG THANK YOU!!!

Gold H4 & Daily


Please click in the link here:
http://blog.mt5.com/elliottfxtrader/2013/12/04/gold-h4-amp-daily-2/

Thank You,
Seb

Rabu, 04 Desember 2013

CFD Trading: The Risk and the Reward Fraction

CFD trading has large potential rewards and potential risks. In this post is the purpose to write about the risk and the reward in a trade.

Risk and reward
A risk in a trade is the possibility to lose money on a trade. A reward is the possibility to earn a profit in a trade.

The fraction between the risk and the reward should be 1:3 or more for new traders. If the risk is 25 dollars is the expected reward 75 dollars. The 25 dollars is the stop loss level and the 75 dollars are the profit takes level.

The fraction for experienced traders could be set to 1:2.

How to use the risk and the reward fraction?
The risk and reward fraction is an overall fraction in a trading plan; if the fraction is set to 1:3 in each trade during a trading day is the overall fraction also 1:3.

Example: The trades
The trading day consists of 6 trades; the profit takes are set to 60 dollars; as the risk and the reward fraction is set to 1:3 is the stop Loss level set to 20 dollars.

Three of the trades are closed due to the profit takes and two of them are closed due to the stop loss level.

The profit is 120 dollars; 3 times 60 dollars minus 3 times 20 dollars.

Example: A trade is added to the trading day
The trader adds a trade in his trading plan but the trade is closed due to the stop loss level.

The profit is 100 dollars; 3 times 60 dollars minus 4 times 20 dollars.

Example: Conclusion
In the example are the risk and the reward fraction as planned but shrink as the trader adds a trade.

The trader’s planned fraction is lower than expected as he added an extra trade in his trading plan; but he still has a surplus.

Stop Loss
It is difficult for both new traders and more experienced traders to set a stop loss level.

Examples of how to set a stop loss level is in the article “Trading Forex Online? How to Define an Exit Point, AlsoCalled a Stop/Loss?” .

Yen Futures Index Daily

 General Overview for 04/12/2013:
The price is getting close to for a Dobule Bottom formation on daily chart and the golden trend line holds the price rallys. Any breakout is potentially bullish BUT confirmation comes only if green line is broken.
From EWP perspective it looks like there was a Triangle formation marked in thick green lines and now this could be last wave 5 to the downside. Breakout above the Monthly Pivot @ 0.9916 is secondary confirmation.

Support/Resistance:
0.9588 - MS1
0.9637 - Swing Low
0.9881 - Grenn Line Resistance
0.9916 - Monthly Pivot
1.0087 - MR1.

Trading Recommendations:
Buy the double botom scenario means: sell EUR/JPY, USD/JPY, GBP/JPY, CAD/JPY, AUD/JPY.

As You might have noticed I'm taking a part in "Analyst of the year" contest organised by InstaForex  broker MT5.com portal.
AND
If You like my analysis or You trade it, or You have learnt something new this is my plea to ALL OF YOU: Please vote for me EVERYDAY!

It is free, simple and easy to vote for me EVERYDAY!

This is what You have to do in four easy steps:
1. Register on MT5.COM forum here:http://www.mt5.com/Register/
2. Wait for confirmation email and activation link
3.Click on the link:http://www.mt5.com/forex_analysis_award/profile/index/elliottfxtrader
4. Click on RAISE UP

THATS IT!

BIG THANK YOU!!!

Senin, 02 Desember 2013

CFD Trading: Correlation between USDCAD and GBPUSD

In the last post was the correlation between the EURUSD and USDCHF illustrated.

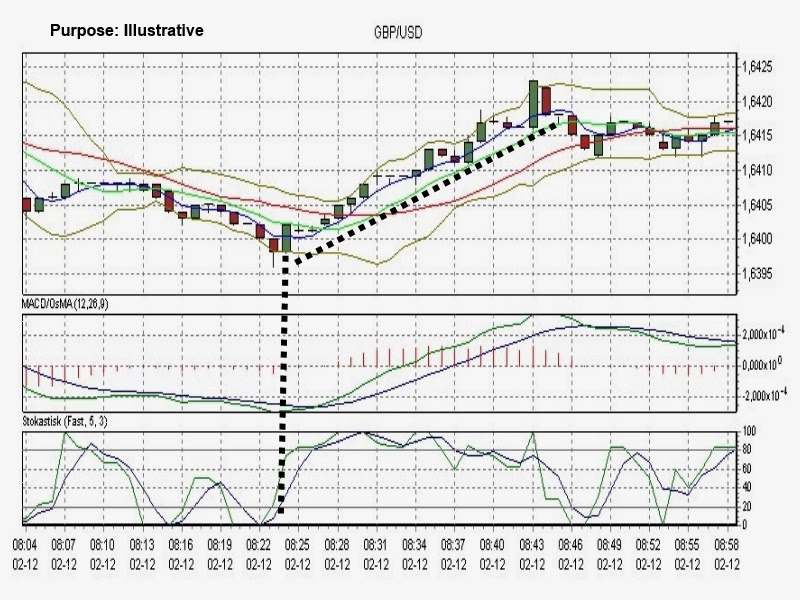
In this post is the correlation between the USDCAD and the GBPUSD illustrated. The purpose is only illustrative and inspirational in trading the USDCAD and GBPUSD.

Correlation between USDCAD and GBPUSD
I was watching the USDCAD and the GBPUSD on the charts and the visual correlation is that if the USDCAD is going sideways is the GBPUSD often in and uptrend or in a downtrend.

The trend of the GBPUSD should not affect the USDCAD if it is going sideways.

An Example
The charts are the USDCAD and the GBPUSD; the USDCAD is going sideways and the GBPUSD is in an uptrend; the GBPUSD trend does not affect the currency rate on the USDCAD as it is going sideways.


Another example
The first example was over a longer time period; this example is over a shorter time period.

The currency pair is the USDCAD and the GPBUSD: the USDCAD is going sideways and the GBPUSD is in an uptrend; the GBPUSD trend does not affect the currency rate on the USDCAD as it is going sideways.


Comment
Please leave a comment if you have some interesting correlation between currency pairs. 

Minggu, 01 Desember 2013

EUR/USD H4 & Daily Price and Time Analysis


General Overview for 02/12/2013:

H4: The 61%Fibo zone has almost been reached in this slow and choppy wave progression but the Sell Zone of grey rectangle area has not been touch. Neverthe less the outlook is to the downside as market has to complete one more cycle down - wave C of a ZigZag OR wave 3 or more impulsive decline.
H4 Dow Analysis: Two bearish formations here on this time frame: Rising Wedges. Moreover any price below L30 is lower low.
D1: Schiff's Median Line target projection here with the same outlook as per H4 chart.
Daily Time Analysis: Monday is important Fibo Time Cluster date and price might react in finding the top for wave 2 or B @ 61%Fibo. With this in mind, more downside wave progression is expected up to 5th Dec when next important FTC date is. Nevertheless, the most important FTC is on 18thDec and that date might act as a time target for wave C OR C to bottom. First target is One-to-One market geometry level @ 1.3084 - 1.3111 area.

Support/Resistance:

1.3831 - Swing High
1.3625 - 1.3678 - SELL ZONE
1.3292 - Swing Low
1.3112 - ZigZag Target Level #1

Trading Recommendations:
Sell Zone is entry area for shorts (Swing Trade):
- With entry @ 1.3625 and SL @ 1.3692 TP @ 1.3111 R/R=7,5 to 1
- With entry @ 1.3649 and SL @ 1.3692 TP @ 1.3111 R/R=15 to 1
- With entry @ 1.3678 and SL @ 1.3692 TP @ 1.3111 R/R= 47 to 1
AVERAGE RISK TO REWARD  RATIO ANYWHERE FROM SELL ZONE IS 23to1.

As You might have noticed I'm taking a part in "Analyst of the year" contest organised by InstaForex  broker MT5.com portal.
AND
If You like my analysis or You trade it, or You have learnt something new this is my plea to ALL OF YOU: Please vote for me EVERYDAY!

It is free, simple and easy to vote for me EVERYDAY!

This is what You have to do in four easy steps:
1. Register on MT5.COM forum here:http://www.mt5.com/Register/
2. Wait for confirmation email and activation link
4. Click on RAISE UP

THATS IT!

BIG THANK YOU!!!